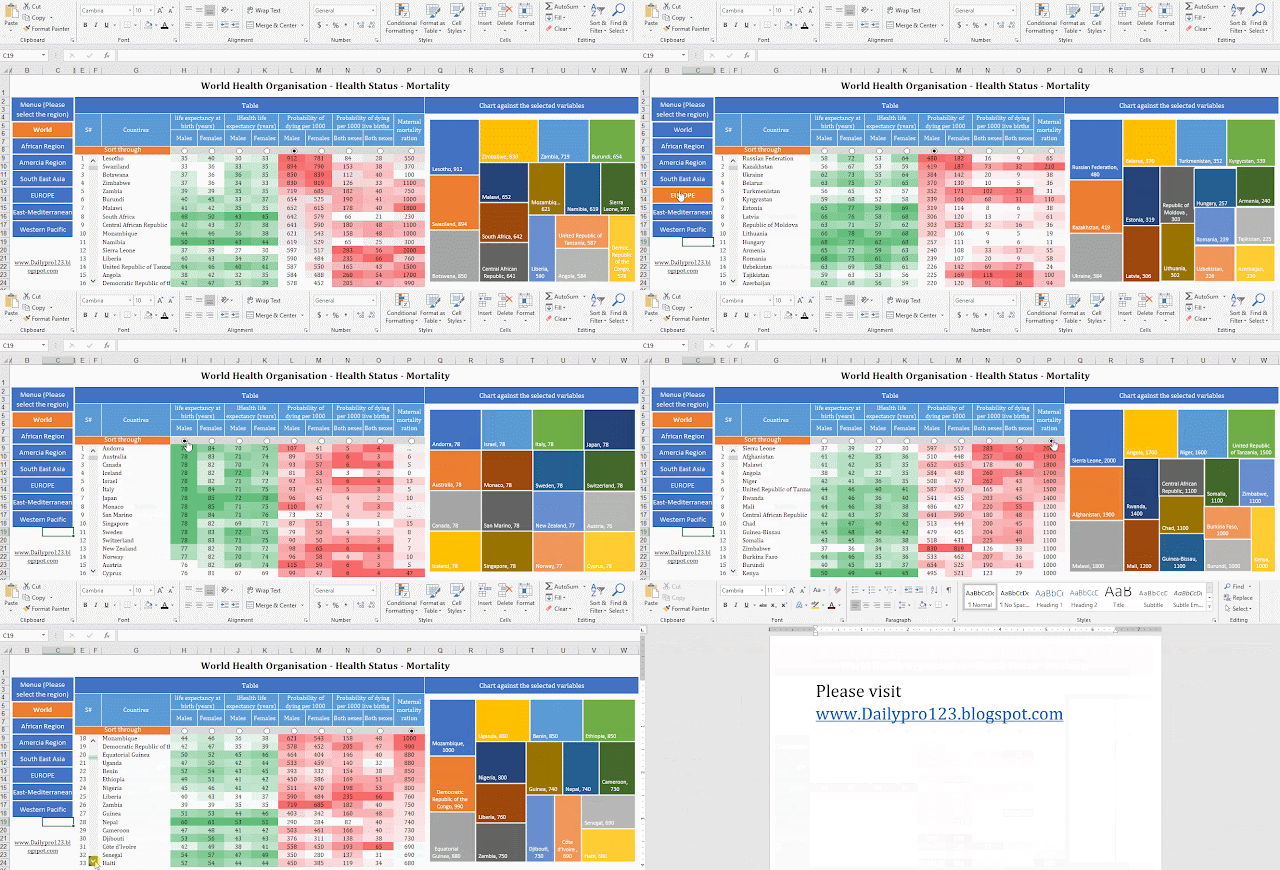
A Quick VBA Enabled Excel Data Visualization
As indicated above, We will make an interactive data visualization dashboard in the next coming posts.
I have used a very simple Excel VBA coding to navigate the options through user friendly buttons which changes the colour once you click on them.
Sorting tool has been enabled against each column through Option buttons. Once you select any option button given on the top of table then the data will be sorted from higher figure to lower for the whole table. Although it can be done through manual sorting techniques but that wont suit the data presentation. Manual sorting can be good while in working mode but not in presentation mode.
Scroll bar is also added to avoid using the external scroll bar. Aim is to show all data in one go - on one display screen only. This shall also avoid the unnecessary display of cumbersome figures.
I have also added one chart on the left hand side which changes dynamically upon selection of any option button, scroll bar or main button.
In the next coming weeks, we will go through each of above mentioned topics in detail.
Please stay tuned, subscribe and follow the blog !


Could you pse share the dashboard to anubalanmenon@gmail.com
ReplyDeleteShared now Anupama...Thanks..
DeleteHi please share on below email id
ReplyDeletepaulo.henrique56@aol.com
Please send a copy to me at andrengpq@gmail.com if possible! Many thanks!
ReplyDeletePls also share with me :) laykoon.tan.sg@gmail.com
ReplyDelete