Photo by Victor Aznabaev on Unsplash
This post is the third part of my series - Coding & Accounting. You may click on below links to read my last articles If you haven't gone through those yet.
Dynamic of the current business environment are making Accountants to provide accurate and timely insights into the organisations systems, processes and data. Modern Data Analytics provides you power to help become a business partner by analyzing the mass data, identifying the wounded process/area/segments and making a future oriented business information case.
How python and Pandas have an edge over conventional tools have been elaborated in my last two articles. In this article i shall highlight the common Excel functions in Python-Pandas.
Installation:
To go further, i assume that you have basic Python coding skills and to perform this, i shall encourage you to have Python and Jupyter Note Book installed on you PC. You may follow below links to install these.
Jupyter Notebook is the IDE for Python. You may work on other available IDEs like Pycharm and Visual Code etc. but i would prefer to work on Jupyter as working with numbers is much easier here.
Common Excel Tasks in Pandas:
1-Reading files:
We can simply read more than 15 types of datasets in Pandas. Excel and CSV files can be simply read by "read_Excel" & "read_CSV" functions. Below i'm taking two dummy datasets in different excel files and going to read these in below lines. One is related to county sales and one is related to region under which each county falls.
Sales Dataset
Regions Datasets against which each county falls
Reading is done just by below two lines.
sales = pd.read_csv("sales_success.csv")
regions = pd.read_csv("regions.csv")
2-Displaying the data
Data can be displayed and examined in multiple ways in Pandas.
- .head() shows the first top rows. You may add any integer value within the brackets and Pandas shall show the top number of those rows.
- .tail() shows the last rows in the data frame. You may also add any integer value within the brackets and Pandas shall show the number of bottom rows.
- .describe() shall provide a complete picture of your data i.e. count, minimum, maximum, standard deviation, median and mean of the columns.
Below is the snapshot of the "head" and "describe" functions.
.describe()
.head()
3-Vlookup
Vlookup is the most common excel function. In Vlookup, we take values from another excel sheets or tab and plot on the existing data-set based on key values.
This function in Pandas is done by "merge".
Pd.merge takes two or multiple data frames and combines them based on the key values.
In the below snapshot, i am merging Sales data frame with Regions data frame based on County names.
"On" parameter defines the column on which merge function actually merge two data-frames.
"How" parameters defines the Data-frame merging option, "left" option describes to show all values of the left data-frame and skip the NAN of the right data-frame.
4-Sum-If
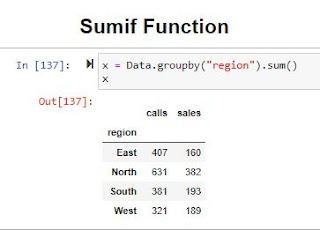
sum-ifs function in excel is used to sum specific values which satisfies a particular criteria. This function in Pandas is done by Sum() and Groupby() function.
"groupby" function groups the items in a specific column and then on top of that we can add the sum function as shown in the below picture.
5-If Function
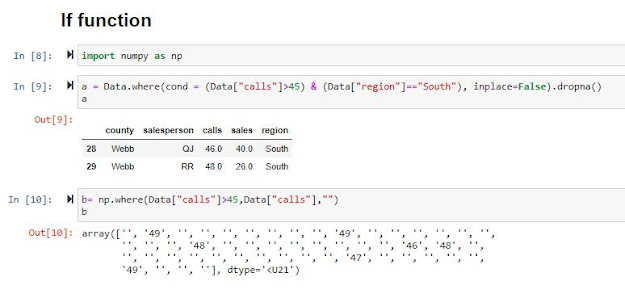
In Excel, if function provides a condition and upon conditions' boolean value, does the narrated task.
This task in Python is done by "Where" function. Numpy and Pandas itself provides Where function. Both are narrated in the below snapshot.
6-Index and Match
Match and Index in Excel provides an alternative to Vlookup with an extra edge, They provide the value of a cell from the specified range.
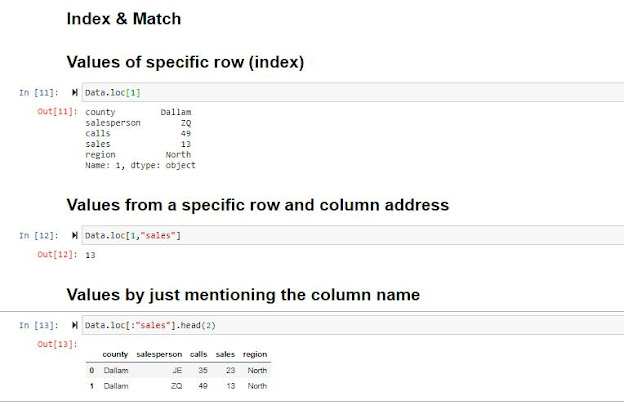
Pandas provides the "loc" function for this. We have to specify the index number (row number) and column name and it shall provide the value of that specific address.
Below are three different scenarios of the "loc" function
7-String Functions
Excel provides the powerful tool to manipulate the strings i.e. lower, upper, trim, left and right etc.
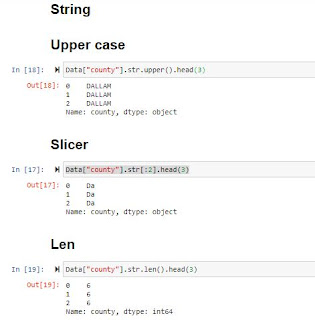
Pandas provides the "str" function which can be applied to any column or particular reference number to perform the string functions. Below are some of the cases.
8-Count-Ifs, average
In the same fashion as sum-if is explained above, Count-ifs and average can also be performed in pandas using the "count" and "mean" along with "groupby".
Below are the examples.
9-Sum, Min, Max, Average
Sum, Min, Max and Average are common excel functions. Pandas also provides the same. Below are the examples of these functions.
10-Saving
We can save the analysis in Excel or CSV format. like in the below example, i have saved it in both excel and csv formats.
This article sums up how we can perform most common excel functions in Pandas. As narrated in my last article, the real power of Pandas would be enjoyed when you use it with other available Python libraries in ML, AI or visualization like Dash and Plotly.


Comments
Post a Comment